Category: AEC

  • Get Your Construction Schedule in the Pink with SmartPM

    Get Your Construction Schedule in the Pink with SmartPM

    Meeting the grade. SmartPM’s dashboard is a mid-term report card of a project schedule. Image: SmartPM.

    Michael Pink is a self-appointed schedule geek. He can look at a construction project that needs to catch up and, like Sherlock Holmes, know how and where it went off track. Better than Sherlock Holmes, Pink can bring the project back into shape.

    We met Pink on the Autodesk University 2024 show floor, where he proceeded to demonstrate his prowess with SmartPM, a one-of-a-kind schedule analysis application.,

    Pink has a history as a schedule fixer. He visited schedule-troubled projects for years for prominent consulting firms like KPMG  and Deloitte until it occurred to him that he could pour what he knew into a software program and have it do what he did – times a hundred!

    Sure, there were project management apps out there, purpose-built for construction even (Newforma, for example), but construction scheduling still had a big blind spot, says Pink.

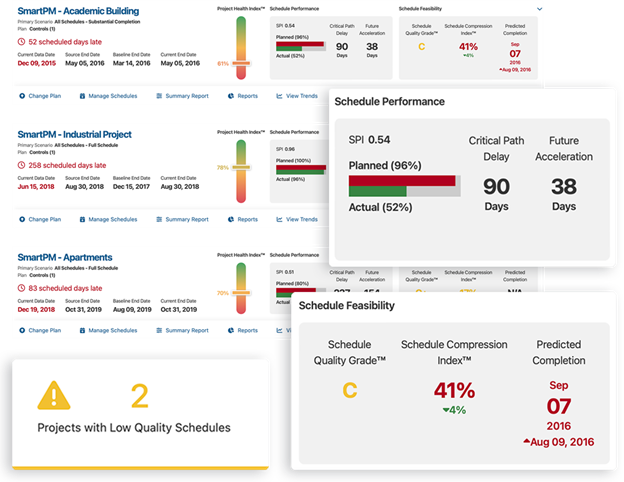
    SmartPM cuts through the clutter of your project and the complexity of project management software by quickly analyzing your project’s timeliness and giving it a letter grade. Like the ASCE does for infrastructure types, SmartPM does for your project. And it does not try to please. It may be programmed to be like your strictest teacher, figuring you may not like to be getting a “C,” but you need to know that your schedule needs work. Think of it as a mid-term grade. You can still do better in the final. And SmartPM will tell you what you need to do.

    What does SmartPM do?

    SmartPM is a cloud-based construction schedule management software that transforms static project schedules into dynamic tools for real-time analysis. It automates key aspects of project controls, including delay analysis and performance tracking. SmartPM helps construction teams identify potential risks early by analyzing scheduling data and providing actionable insights through intuitive dashboards. This software excels in monitoring project timelines, forecasting potential delays, and ensuring schedules align with real-world progress.

    By utilizing advanced algorithms, SmartPM offers predictive analytics and automated reports, allowing stakeholders to make data-driven decisions, reduce risks, and maintain project efficiency. Its real-time schedule analytics keep all team members informed, ensuring transparency and improved collaboration. The platform is of particular value for turning complex schedule data into understandable metrics, aiding contractors, developers, and project managers in mitigating delays and budget overruns.

    How does SmartPM do it exactly?

    SmartPM uses advanced data analytics and automation to provide insights into project schedules. Here’s how it works:

    1. Schedule Data Integration: SmartPM integrates with standard construction scheduling software like Primavera P6 and Microsoft Project. Users upload their project schedules, and SmartPM processes the data to track and monitor progress in real time.
    2. Automated Analysis: The platform applies algorithms to identify risks, inefficiencies, and potential delays in the project timeline. It uses critical path analysis, float analysis, and baseline comparisons to detect where projects are falling behind or facing risks.
    3. Delay and Risk Detection: SmartPM automatically detects delays by comparing the planned schedule with the actual progress. It analyzes impacts on critical activities and provides predictive insights on how these delays might affect the overall project.
    4. Visual Dashboards and Reports: The software translates complex scheduling data into easy-to-understand visual reports and dashboards. These reports allow project managers to see trends, pinpoint issues, and make informed decisions quickly.
    5. Aids Collaboration. SmartPM’s cloud-based system allows for real-time collaboration between all stakeholders. This ensures that everyone is on the same page regarding project progress, risks, and necessary adjustments,

    By automating much of the heavy lifting in schedule management and making data actionable, SmartPM helps construction teams stay on track and avoid costly overruns.

    What sort of firm or job role would use SmartPM, and when would it be used in terms of the total project timeline?

    SmartPM is typically used by construction professionals and firms involved in large, complex projects. Key users include:

    1. General contractors and construction managers can use SmartPM to ensure projects are on track by continuously monitoring schedule progress, identifying delays, and proactively mitigating risks. Contractors often use it to manage large portfolios of projects, where real-time oversight is crucial.

    2. Developers can use SmartPM to drill down to detailed information about the causes of delays in their projects. Owners can use it to track overall project health and hold contractors accountable for delays or slip-ups.

    3. Project managers and schedulers can use SmartPM to dig deep into scheduling data, perform delay analysis, monitor critical milestones, and provide regular updates to stakeholders. They utilize SmartPM from the planning phase through to project completion, especially during execution, when real-time adjustments are crucial.

    SmartPM is valuable throughout the entire project timeline but becomes particularly critical during execution and construction phases, where its ability to detect and resolve issues in real-time can prevent project delays and cost overruns.

    How is SmartPM implemented?

    SmartPM implementation is designed to be user-friendly and straightforward, but it does involve several steps to ensure optimal use.

    Data Input: The first step in implementation is uploading existing project schedules from software like Primavera P6 or Microsoft Project. It only takes minutes for users to upload their schedules into SmartPM, depending on the size of the project file. Once uploaded, SmartPM automatically processes the data and begins generating insights and reports.

    Training. This is critical for users to utilize SmartPM’s capabilities fully. Typically, companies receive initial training sessions from SmartPM experts, which include demonstrations and guidance on how to navigate the platform, use its analytics tools, and generate reports. Most users find the interface intuitive but depending on the size and complexity of the team, it might take a few days to a week for teams to get comfortable with all the platform’s features.

    Support: SmartPM provides ongoing support after implementation. Users benefit from long-term support, including access to a client success team and technical support. Support is available throughout the lifetime of the license agreement, ensuring that any issues or questions are addressed and updates are implemented.

    How Did SmartPM Get Started?

    Only you – with SmartPM – can prevent schedule drift. Michael Pink, CEO and founder of SmartPM. Image: LinkedIn

    After the light bulb turned on for Mike Pink, he immediately offered it to his employer. The consulting firm he was working for was less than thrilled at the idea of Pink’s software putting them out of work. Makes sense. Who would pay $400-$500 per hour if you have an app to do the same thing for about the same per month?

    Pink would not let the idea go. He quit to pursue the idea on his own in 2012, consulting by day to pay the bills and developing SmartPM on nights and weekends. He got lucky to find  “a truly great programmer.” This led to an early-stage funding of $500K in 2019, followed by Series A funding rounds.

    Leading the funding rounds is Building Ventures, from which one of the partners, Allen Preger, a co-founder of NewForma, is present.

    “They get construction,” says Pink, ever so thankful for not having to face VCs that can’t spell AEC – at least until the next round.

  • FRAMECAD Launches Nexa for Cold-Formed Steel Framing Projects

    FRAMECAD Launches Nexa for Cold-Formed Steel Framing Projects

    Cold-formed steel (CFS) members, formed out of sheet metal, CFS, have better strength-to-weight ratios than conventional steel and wood structural members. Image from FRAMECAD video.

    FRAMECAD, a maker of steel-forming machines and software for the manufacture and implementation of cold-formed steel (CFS) structural members, has introduced Nexa, a “production management platform” for building projects made using CFS.

    Nexa is meant for any company that builds with CFS, from panelizers (those that make panels, such as walls, floor, or roof panels for modules) to builders that build whole pre-fab modules.

    Nexa will import a CAD or BIM model and take over from there, controlling how the CFS members are formed out of stock, a roll of steel, how they are assembled, showing each member in all its detail, and following through to its assembly on site. Throughout it all, a dashboard view tracks the project, showing progress, including percent completed.

    Why Use Structural Parts Made From Sheet Metal?

    Sheet metal may seem an unlikely choice for buildings. They are accustomed to thick, heavy structural members. Still, with the correct shape and sufficient support to prevent buckling, they can be highly efficient structurally, with strength-to-weight ratios better than wood and conventional structural steel, AKA hot-rolled steel, such as I-beams. Such structural efficiency, as well as lower cost, make them the first choice in certain types of construction, particularly modular construction, but increasingly in low-rise and mid-rise buildings. It also helps that they can be cut faster than hot rolled steel and more precisely than wood. Their light weight makes them easy to move around during manure and construction, as opposed to weighty I-beams and timber beams that require cranes to lift and position.

    FRAMECAD also sells CFS machines that take rolls of steel and convert them to structural steel shapes. Image FRAMECAD.

    Provide real-time data for capacity planning and inventory management. Nexa can track materials and ensure compliance with regulations while maintaining traceability for both materials and processes.

    Project Management: Nexa users get real-time visual updates on project project progress. Centralized data access, AKA a single source of truth, enables all stakeholders, from factory teams to field workers, to collaborate more effectively and speed up workflows. Real-time dashboards show easy-to-read gauges for how much of a building has been built.

    Nexa also helps with logistics and optimizes stacking, packing, and delivery coordination.

    What is Cold-Formed Steel?

    Commercially available cold-formed steel (CFS) shapes. Image: ResearchGate paper by Perampalam Gatheeshgar.

    Cold-formed steel framing (CFS) refers to a construction technique where thin sheets of steel, shaped by rolling or pressing at room temperature, are used to create structural elements within walls, floors, roofs, etc.

    Forming sheet metal into structural shapes has the apparent advantage of being lighter than both solid wood members or hot-rolled steel – but must be designed to overcome the sheet metal’s tendency to buckle under compressive loads, much less likely in thick, heavy shapes. This requires additional design considerations and often more bracing or stiffening.

    Compared to wood, CFS can be seen as preserving trees and natural resources. And it doesn’t rot or is prone to pests like termites. It can be cut more precisely and hold its shape, while wood has “movement” and will warp, shrink, and expand. Being non-isotropic, it is never the same way in all directions. Steel is much better behaved. It’s no wonder engineers prefer steel over most other materials.

    So Why Are We Still Using Wood?

    With all of wood’s disadvantages, why use it all the time for residential construction? Oh, yeah. It is, or was, plentiful. This convenience of plenty built entire cities of wood, like San Francisco made from California redwoods. The city burnt to the ground in the 1906 earthquake as the wooden building with wooden roofs was only too quick to ignite.

    However, in commercial building design and construction, architects and engineers need to be aware that by its nature, CFS weakens more quickly than hot-rolled steel in fires. Its thinness makes it harder to weld and gives corrosion a better shot at weakening the whole member. You must also compensate for its thermal conductivity, which is practically a thermal short circuit, while wood is an effective insulator. Also, if you think your next motel walls are thin, it’s more likely the fault of CFS, which transmits vibration (sound) better than wood.

    So look for more cold-formed steel in buildings as modular construction becomes more popular, though not discovered by homeowners until their stud finder can’t find studs and their screws don’t penetrate. But if you see it on a bridges, don’t cross. If you hear about it in a high rise, don’t get the condo.

  • Zoom In from Mountains to See Grains of Sand

    Zoom In from Mountains to See Grains of Sand

    With Cesium, you can keep zooming in to see a stunning amount of detail, to pebbles if not grains of sand. Image: Cesium.

    Bentley Systems acquired Cesium last month and made a big deal of it at their Year in Infrastructure event, which recently concluded in Vancouver.

    Cesium, a leader in the visualization of 3D geospatial data, is an open platform. The company specializes in creating high-precision, time-dynamic 3D geospatial data used in various sectors such as defense, infrastructure, and urban planning. With this acquisition, Bentley aims to integrate Cesium’s graphic streaming technology into its iTwin platform, enhancing digital twin capabilities for infrastructure projects worldwide.

    Bentley promises to let Cesium be open-platform, used by other vendors, even if they are Bentley’s competition.

    Cesium’s expertise will allow for the visualization and analysis of large-scale 3D geospatial data in real time, improving decision-making processes for engineers and developers. The acquisition also reinforces Bentley’s commitment to open standards and interoperability, ensuring that Cesium’s technology remains accessible to a broad range of industries and users. By combining forces, both companies aim to push the boundaries of infrastructure engineering and digital twin applications globally.

    How much Bentley paid for Cesium was not disclosed.

    Bentley’s CTO Julien Motte greets Cesium CEO Patrick Cozzi on the main stage at Bentley Systems Year in Infrastructure 2024.

    Cesium CEO Patrick Cozzi justifies selling the open-source platform to Bentley by emphasizing the alignment of values and the long-standing relationship between the two companies. Cozzi highlights that both Bentley and Cesium share a commitment to open standards, open-source technologies and APIs, which are fundamental to Cesium’s mission. He points out that Bentley’s support for their efforts in open standards and open sources, including their contributions to 3D Tiles and CesiumJS, reflects their dedication to interoperability and openness, making the acquisition a natural extension of their collaboration.

    Cozzi also notes that by joining Bentley, Cesium can accelerate its vision and expand its platform’s reach in the built and natural environments. He stresses that Bentley’s resources will enable Cesium to deliver on long-requested features and capabilities faster than it could have as an independent company, thus benefiting the broader developer ecosystem that relies on Cesium.

    About Cesium.

    Cesium got its name from the chemical element cesium (also spelled “caesium”), which is known for its use in atomic clocks and GPS technology. The element cesium is significant for its precision in timekeeping and geolocation, which resonates with Cesium’s mission of providing accurate, high-performance 3D geospatial data. The name reflects the company’s focus on high-precision, time-dynamic, and massive-scale geospatial applications, similar to the role cesium plays in providing time synchronization for global positioning systems. This connection to precision and geospatial accuracy likely inspired the company’s founders when selecting the name.

    How Does Cesium Work?


    Cesium manages massive graphical datasets using a technology called 3D Tiles, which breaks down large-scale geospatial data into smaller, manageable pieces, or “tiles.” This tiling process allows the system to display data at different levels of detail depending on how close the viewer is to the object.

    Multidisciplinary firm Pennoni created a video using Cesium and Google’s 3D Tiles to visualize the dolphins (round concrete structures) that guard the Delaware Bridge against errant big ships, such as the MV Dali that plowed into the Francis Scott Key Bridge on March 6, 2024.
    Picture from video by Pennoni.

    When you are viewing a scene from a distance, like looking at a mountain range, Cesium shows only the larger, coarser tiles that represent the overall shape and structure. As you zoom in, more detailed tiles are loaded dynamically, displaying finer details, down to the granularity of grains of sand if necessary. This hierarchical structure, somewhat similar to fractals, allows Cesium to efficiently handle datasets that span vast areas while maintaining high performance and detail at any scale.

    The tile-based approach ensures that only the necessary amount of data is processed and visualized at any given time, reducing memory and computational load while delivering seamless zooming and panning across large datasets

  • Fuzor is Groundbreaking. Literally.

    Fuzor is Groundbreaking. Literally.

    Amongst all the booths on the show floor at Bentley Systems Year in Infrastructure, one was getting a lot of attention. Happy customers were dropping by the Fuzor exhibit to shake hands and give thanks. This was no startup looking to get noticed. This was a company that had already arrived. I had some catching up to do.

    It turns out Fuzor is a comprehensive virtual design and construction (VDC) software purpose-built for animating every bit of the construction before it takes place. 

    Use it on the job or before to get the job.

    “We found that firms are using Fuzor to win contracts,” says Pat Argiles, VDC Accounts Manager at Fuzor, “who proceeded to open my eyes with what all that Fuzor can do, showing exactly how the dig, grading, construction, complete with earth moving equipment and cranes, is going to happen. Getting the job after seeing this careful preparation would be a slam dunk for any construction firm. Then, after they get the job, construction firms can commence with the work, all sequencing neatly orchestrated, with little left to chance.

    With Fuzor, contractors can see animations of equipment moving in and moving about, dirt being dug, and cranes hoisting steel… all of it in 3D. There could be no better big-picture guide on how to get from brownfield to high rise – or whatever building or structure is going up.

    We see 3D earthmovers and cranes in operation. They, and much more equipment, have been modeled and are available in a library.

    Fuzor has a suite of advanced features for architects, engineers, and project managers. At its core, Fuzor provides 4D simulation (the 4th dimension, time, so animation)  so construction firms can create construction sequences over time by integrating building information models (BIM) with scheduling data. This dynamic simulation allows stakeholders to foresee how projects will progress day by day, enabling them to plan logistics, manage resources, and prevent delays.

    Fuzor enters yet another dimension: 5D, which adds cost data to the model. You can use it to track the financial impact of scheduling decisions in real-time.

    You can check out a project in virtual reality (VR). Fusor’s integration creates an immersive environment where team members can explore the project as if it were already built, aiding in design reviews and stakeholder presentations. This realistic experience enhances communication, ensuring everyone has a clear understanding of the project.

    Fuzor is not just about building; it can be used for civil infrastructure projects, with animations of roads, bridges, and tunnels, incorporating material properties and environmental conditions. Urban planners can get into it, too, for land use, transportation systems, and city planning scenarios, facilitating sustainable development.

    What Makes Fuzor Different?

    Fuzor distinguishes itself from other VDC software in several key ways:

    • Real-Time Rendering and Immersive Visualization: Fuzor provides real-time rendering, allowing users to make changes to models and instantly see their impact. This includes integration with virtual reality (VR), giving stakeholders a highly immersive experience where they can walk through and interact with models.
    • 4D and 5D Simulations: Unlike some VDC tools that focus primarily on 3D models, Fuzor incorporates both time (4D) and cost (5D) simulations. This feature allows users to visualize not just the building’s design but also the construction process over time and its financial implications.
    • Advanced Collaboration Tools: Fuzor enables multiple stakeholders to work simultaneously on a project in real time. This collaborative approach ensures that architects, engineers, contractors, and clients stay aligned throughout the project lifecycle, improving communication and reducing errors.
    • Microtask Planning and AI Automation: Fuzor’s microtask planning enables detailed site activity simulations, while its AI-driven automation simplifies linking 3D models to schedules. These features reduce manual workload and improve accuracy by ensuring that schedules and designs remain in sync in real-time.
    • Civil Engineering and Urban Planning: In addition to its architectural capabilities, Fuzor is widely used in civil engineering and urban planning. It allows users to simulate the structural behavior of complex infrastructure like roads and bridges, making it versatile for both building and infrastructure projects.

    The Fuzor Story

    Fuzor was developed by Kalloc Studios, a company founded by Henry Yu in 2006. Initially, Kalloc focused on game development, working with major game companies like Electronic Arts and THQ. Yu may have tired of Grand Theft Auto, inventing more ways of killing people, and wished to do something more constructive. Yu and his team transitioned to the architecture, engineering, and construction (AEC) industry, leveraging their gaming expertise to create high-performance visualization tools.

    Fuzor was officially launched in 2014, emerging from Kalloc’s Instant Preview Engine technology, initially designed for game designers. Fuzor’s core mission is to integrate real-time rendering and 4D/5D simulations with BIM tools, enhancing project planning, design, and collaboration in construction. It allows users to visualize complex designs, simulate construction sequences, and track costs over time, all within a virtual reality (VR) environment.

    Kalloc Studios’ headquarters are located in Carlsbad, California (famous for another construction company, though it is with little plastic bricks), with additional offices in Hong Kong.

    Find out more about Fuzor here.

    —–

    *LEGOLAND

  • San Diego Airport Gets a Facelift. Should It, Though?

    San Diego Airport Gets a Facelift. Should It, Though?

    San Diego’s new Terminal 1. Image Gensler/Autodesk.

    There may be no airport left in the United State like San Diego International. That it is a one-runway airport is not that unusual. But that it is downtown, surrounded by a picket fence of skyscrapers, is extraordinary. Those in the high-rise offices may get a kick out of viewing jets fly in and out at eye level, but I wonder if it is totally a white-knuckle experience for the pilots threading the needle between skyscrapers.

    Most major metro airports have moved outside of harm’s way. London’s Heathrow (LHR), San Francisco (SFO), Hong Kong (HKG), Chicago (OHR), but San Diego (SAN)  clings to its time begone airfield surrounded by high rises. US Navy pilots landing on a pitching aircraft carrier deck may be aviation’s biggest challenge, but flying into SAN may be the biggest civil aviation’s biggest challenge. But when was aircraft flying into skyscrapers a problem? Oh, yeah. 9/11. I knock on wood.

    But instead of heeding a warning, San Diego is doubling down on what doomsayers would think a bad bet. The terminal is getting a $3.8 billion makeover with a new terminal (1 (NT1).

    Who is doing the design and construction?

    AECOM and Gensler are playing significant roles in the major renovation of San Diego International Airport, focusing on enhancing infrastructure, accessibility, and sustainability.

    AECOM has been selected by the San Diego County Regional Airport Authority to lead the program management for the airport’s Capital Improvement Plan. This includes overseeing the $3.8 billion New Terminal 1 project and the modernization of Terminal 2 East. Key aspects of their involvement include managing the construction of a new entrance road, integrating bike lanes and pedestrian paths, and reserving space for future public transit connections to the airport. The improvements aim to accommodate increasing travel demand while enhancing passenger experience and operational efficiency.

    Gensler, as an architectural firm, contributes its expertise to aviation design. They are focused on creating a more inclusive and efficient airport experience, leveraging their knowledge to design innovative spaces that balance functionality with passenger comfort. Gensler’s work includes implementing sustainability measures and adapting airport design trends like electrification and modular construction to minimize the environmental impact.

    What role has Autodesk played?

    Autodesk has played a significant role in the renovation of San Diego International Airport, particularly in the transformation of Terminal 1 into a modern facility. The company’s design and construction solutions are central to this effort, with tools like Autodesk Docs being used as the common data environment. This platform allows project managers and teams to collaborate seamlessly, storing and sharing all relevant project data in one place.

    AECOM, which leads the program management, is utilizing Autodesk’s suite of digital tools to ensure efficient design and construction workflows. Additionally, architecture firm Gensler employed Autodesk Revit to redesign Terminal 1, including the creation of the “Luminous Wave” façade, which enhances natural lighting and passenger experience. The overall project aims to bring the airport in line with contemporary needs, with features like expanded gates, improved roadways, and sustainable designs being central to the renovation efforts.

  • The Best Infrastructure Designed with Bentley Software of 2024

    The Best Infrastructure Designed with Bentley Software of 2024

    Winners of Bentley Systems Year in Infrastructure 2024 awards. Image: Bentley Systems

    Winners of Bentley Systems Year in Infrastructure 2024 were announced in Vancouver at what is the only black-tie gala event in the industry. Here are all 12 categories and winners.

    Structural Engineering

    And the winner is…Hyundai Engineering of Seoul, South Korea for the New Physical Modeling Method for Plant Steel Structures Using STAAD API.

    Hyundai Engineering developed a new physical modeling method for plant steel structures using STAAD API to automate structural design processes. The project aimed to reduce repetitive tasks, enhance design efficiency, and improve constructability by creating an analytical digital twin. The approach led to a 70% reduction in structural analysis time and cut design errors by 50%, saving approximately KRW 330 million.

    The software used in this project includes STAAD for structural analysis and design automation, which optimized the design process while considering constructability enhancements.

    Bridges and Tunnels

    And the winner is…JMT of Fredricsburg, Virginia for the Digital Experience for the I-95 Rappahannock River Crossing Construction Project .

    The I-95 Rappahannock River Crossing Project in Virginia aimed to reduce congestion by adding six miles of new lanes and four bridges. JMT’s digital approach helped them manage traffic flow during construction and meet environmental standards. By using advanced modeling and simulations, they identified and resolved issues early, saving time and reducing community impact.

    The software used in this project includes Bentley Descartes, Bentley Infrastructure Cloud, iTwin, MicroStation, OpenBridge, OpenRoads, ProjectWise, and LumenRT.

    Surveying and Monitoring

    And the winner is…Water Supplies Department in Kowloon, Hong Kong for the Digital Twin of the Ex-Sham Shui Po Service Reservoir.

    The North East Link Central Package, Victoria’s largest infrastructure project, aims to improve connectivity by removing 15,000 trucks from congested roads in Melbourne. The project required complex geological modeling and the coordination of multiple design consultancies to manage subsurface risks. By utilizing advanced geotechnical data and 3D models, the team optimized design, risk management, and construction planning, saving AUD 16 million.

    The software used in the project includes GeoStudio, Leapfrog, OpenRoads, PLAXIS, and ProjectWise.

    Rail and Transit

    And the winner is…SPL Powerlines UK for the Midland Main Line Electrification.

    The Midland Main Line Electrification (MMLE) Project aims to enhance rail capacity with 447 kilometers of overhead electrification, reducing travel times and improving sustainability. SPL Powerlines UK used advanced digital tools to manage the project across multiple sections, coordinating data from 20 design organizations. This approach increased first-time submission success by 26%, cut site walkouts by 94%, and improved safety and cost-efficiency.

    The software used in this project includes ProjectWise for collaboration, iTwin for digital twin creation, MicroStation for design, and OpenRail for rail-specific modeling, among others such as AssetWise and LumenRT.

    Facilities, Campuses and Cities

    And the winner is…China ENFI Engineering Co., Ltd. for Project of Comprehensive Waste Management Facilities in Xiong’an New Area.

    The Xiong’an Waste Comprehensive Treatment Facility Project is designed to transform the area into a “waste-free city,” processing 3,060 tons of garbage, kitchen waste, sewage, and medical waste daily in a 220,000-square-meter underground facility topped by a park. China ENFI Engineering Co. faced challenges with ventilation, equipment space, fire protection, and a tight schedule. They turned to Bentley’s digital tools, moving from 2D drawings to 3D modeling, unifying 13 design specialties. This shift boosted efficiency by 130%, reduced errors, eliminated the need for four cranes, and saved CNY 13.7 million. Careful planning also cut 50 days from the construction timeline.

    The Xiong’an Waste Comprehensive Treatment Facility Project relied on Bentley software tools such as ProjectWise for project delivery, SYNCHRO for construction management, MicroStation for CAD modeling, and the iTwin Platform to implement a digital twin approach,

    Construction

    And the winner is…Proicere Ltd.,of Seascale, U.K. for the SPRS Retreatment Plant (SRP) Sellafield.

    The Sellafield SPRS Retreatment Plant is part of the UK’s Nuclear Decommissioning Authority initiative, aiming to safely transfer, repackage, and store 140 tons of plutonium for 100 years. The project, managed by Proicere Ltd., faces strict regulatory and safety standards, requiring a highly coordinated digital approach. By utilizing 4D planning, they identified over 160 risks, preventing rework and reducing costs, thus ensuring project sustainability.

    The software used in this project includes SYNCHRO for 4D planning and scheduling, and,iTwin for creating a digital twin to streamline workflows and enhance risk management.

    Enterprise Engineering

    And the winner is…Mott MacDonald and HDR of Toronto, Canada for the Ontario Line – Information Management.

    ,

    The Ontario Line is a 15.6-kilometer subway project in Toronto, aimed at improving transit and reducing road congestion. The line will add 15 new stations, significantly cutting travel times and lowering emissions by removing 28,000 cars from the roads. Mott MacDonald and HDR, the technical advisors, focused on efficiently managing and sharing data among multiple organizations, enhancing project efficiency.

    The software used in this project includes iTwin for digital twin management, ProjectWise for data collaboration, SYNCHRO for 4D planning, and Bentley LumenRT for visualization and modeling.

    Roads and Highways

    The winner is the Department of Public Works and Highways (DPWH) in Manilla, Philippines for the Digital Twin Implementation for NLEX-SLEX Connector Road Project.

    The NLEX-SLEX Connector Road Project in Metro Manila addresses severe traffic congestion by constructing an eight-kilometer elevated road connecting major highways. This project significantly reduces travel time and carbon emissions. Challenges such as dense urban environments and equipment logistics were overcome through advanced digital twin technology, improving project efficiency and reducing errors.

    The project utilized Bentley software, including iTwin Capture for field conditions, OpenBridge and OpenRoads for 3D modeling, LumenRT for visualization, and SYNCHRO for 4D construction management, enhancing productivity by 15% and logistics by 40%.

    Power and Process

    And the winner is…PowerChina Zhongnan Engineering Corporation Limited of Dongying, Shandong, China for the Digital Twin of Shandong Energy Group Bozhong Offshore Wind Farm Site A.

    The Bozhong Offshore Wind Farm Site A, developed by PowerChina Zhongnan Engineering, is the first grid-parity offshore wind project in Shandong, China. It will generate 1.698 billion kilowatt-hours of clean energy annually, reducing carbon emissions by 1.26 million tons. The project overcame challenges such as complex site conditions and tight deadlines by leveraging digital twin technology, improving efficiency and reducing costs.

    The software used includes Bentley Raceway and Cable Management, MicroStation, OpenBuildings, OpenPlant, OpenRoads, OpenWindPower, PLAXIS, ProjectWise, and ProStructures. These tools enabled better collaboration, 3D modeling, and intelligent workflows.

    Subsurface Modeling and Analysis

    And the winner is… Spark and WSP of Melbourne, Australia for the North East Link Central Package.

    The North East Link Central Package, Victoria’s largest infrastructure project, aims to improve connectivity by removing 15,000 trucks from congested roads in Melbourne. The project required complex geological modeling and the coordination of multiple design consultancies to manage subsurface risks. By utilizing advanced geotechnical data and 3D models, the team optimized design, risk management, and construction planning, saving AUD 16 million.

    The software used in the project includes GeoStudio, Leapfrog, OpenRoads, PLAXIS, and ProjectWise, which streamlined data integration, collaboration, and modeling for efficient project delivery.

    Power Transmission and Distribution

    And the winner is… Southwest Electric Power Design Institute Co., Ltd. of China Power Engineering Consulting Group In Liangshan, China for Full Life Cycle Digital Applications of Butuo ±800kV Converter Station

    The Butuo ±800kV Converter Station is part of China’s energy infrastructure, transmitting power from Baihetan Hydropower Station to eastern regions. This project reduces coal consumption by 27 million tons annually and provides electricity for 75 million people. By utilizing digital workflows, the team minimized land use and lowered costs, shortening both the design and construction periods significantly.

    The software used includes Bentley LumenRT, MicroStation, OpenBuildings, OpenSite, OpenUtilities Substation, ProjectWise, and STAAD, which facilitated collaborative design, 3D modeling, and project management across the entire lifecycle.

    Water And Wastewater

    And the winner is…Basic Sanitation Utility Company of the State of São Paulo for the Integra 4.0  Cultural Transformation Through Digitalization.

    SABESP’s Integra 4.0 project aims to revolutionize water management across 375 municipalities in São Paulo, Brazil, through digital transformation. By integrating business intelligence and AI into a single platform, the project significantly improves operational efficiency, reducing water losses by 29%. Within seven months, it saved BRL 3.1 million in maintenance costs and reduced carbon emissions through proactive monitoring and rapid response to system issues.

    The software used includes OpenFlows for hydraulic modeling and monitoring, providing an integrated, data-driven approach to optimize water resource management and infrastructure maintenance.

  • Bentley’s OpenSite Gets an AI Plus

    Bentley’s OpenSite Gets an AI Plus

    Bentley’s OpenSite+ software with copilot uses organization-specific documents and design models for quick insights and edits. Image: Bentley Systems.

    Bentley Systems introduced OpenSite+, a generative AI-based software that aims to significantly streamline certain civil site design processes, at the Year in Infrastructure 2024 conference recently held in Vancouver, Canada.

    OpenSite+ is an AI upgrade of OpenSite Designer and part of Bentley’s suite of engineering civil engineering software for site planning. It aims to reduce time and effort in creating, analyzing, and optimizing site layouts. It integrates data-driven automation and machine learning, enabling civil engineers to consider more designs and reduce manual effort.

    OpenSite+ is presented as a game-changer for civil engineers involved in land development for residential, commercial, and industrial projects. By utilizing generative AI, OpenSite+ can automatically generate various design alternatives in 3D, allowing engineers to choose the best-solutions based on a variety of criteria like topography, regulatory compliance, and construction feasibility.

    What Does OpenSite+ Do?

    • Automated Drawing Production: Users can reduce time spent on mundane drawing tasks, accelerating drawing production by up to 10 times, says Bentley. Drawing will include AI-powered annotation, labeling, and sheeting. Bentley promises annotations will be in the right place, corresponding to a company’s standards and aesthetics. This an answer to all automatic dimensioning that have come before which would systematically litter drawings with dimensions with little or no regard to simplicity and elegance.
    • Enhanced Design Experience with Copilot: Users can quickly create, revise, and interact with site plans and 3D site models through a natural language interfaces—including voice. With iPad increasingly used on sites and requiring two handed operation, voice input makes even more sense on a jobsite than it does in the office.
    • Optimization. OpenSite+ can generate thousands of site plans and rank them for you with one touch of a button. Ranking can be done by the amount of cut and fill each design requires, which is precisely calculated from the 3D model, according to Bentley. Costs can be estimated, too.
    • Smart Design Tools: Users can create and revise designs using intelligent, editable objects such as building pads, parking layouts, driveways, sidewalks, and ponds to complete projects in a fraction of time compared to traditional CAD software. We are to see this in operation at Year in Infrastructure — with voice command, no less. A parking lot shape is changed and the parking spaces are redrawn on stage after a voice prompt.

    A key feature of OpenSite+ is its ability to learn from a firm’s historical design data, which should make its design suggestions more relevant and potentially more useful than a random design generator. I am reminded of generative design, which does not take design intent or stock shapes into account, and therefore, produces mostly junk. OpenSite+, on the other hand, can be fed the projects of the past and produce site plans as would the company’s own seasoned engineers.

    Bentley is not suggesting that OpenSite+ be used to replace seasoned engineers out of work, but rather freeing them from drudge works so they can be more creative. Making drawings is a case in point and may end up being OpenSite+ most cherished feature. Drawing, which theoretically should have gone the way of the drafting board, continue to be a requirement on most projects, binding a firm to the past and adding costly work. Maybe now, they’ll finally go away, at least for civil engineers?

    “OpenSite+ is a game-changer,” says Joe Viscuso, Senior Vice President and Director of Strategic Growth, at Pennoni, on the Bentley website and in person at YII. “ By combining design and routine tasks into one powerful platform, it eliminates the need to switch between multiple programs. It streamlines our workflow, automates repetitive tasks, and ensures accuracy as we make changes in real time. This means faster project completion with superior results, helping Pennoni stay ahead of the curve in both technology and innovation.”

    OpenSite+ is currently available as “early access.” You have to apply for it and you must be in North America.

  • Bentley’s iTwin Offers Integrates Carbon Analysis

    Bentley’s iTwin Offers Integrates Carbon Analysis

    Example of Bentley’s Carbon Analysis capabilities: Embodied carbon visualization in an airport design (Photo: Bentley Systems)

    Bentley Systems introduced a new tool for carbon analysis at the company’s Year in Infrastructure event. The tool works within its iTwin Experience platform to show where in the whole project the carbon footprint is the greatest so engineers and designers can do something about it at the design stage.

    The tool aims to streamline the process of calculating embodied carbon, which is indicative of how much carbon emissions will result from a project’s structures from conception to cradle to grave.

    Before such integration of a carbon analysis tool, anyone attempting carbon analysis would have had their patience tested. They had to leave their favored application, open some unfamiliar program, tap into a materials database, enter all parts of the BIM model manually (no way, there can be thousands!) or try to import them, then have the program churn through all that and dump a massive report in your inbox.

    Who got time for that?

    It’s enough to deter the most environmentally gung-ho engineer. But Bentley Systems, bless their souls, have integrated a carbon analysis tool in Bentley’s iTwin, effectively slicing through the Gordian knot that is today’s carbon analysis. iTwin users can see their BIM model in a carbon light, so to speak, all parts now lit up in a color that indicates their carbon impact. Blue is good and red is bad. It’s that simple. [I would have preferred green for good and black for bad; it is more analogous to environment flags, but blue to red follows traditional analysis color mapping.]

    Don’t you like how much red you see in your project? Reach into the Carbon Analysis tool and change the material. You could also change the shape and reduce the volume, reducing the amount of environmentally offending material used, but we don’t know if Bentley’s Carbon Analysis takes volume into account.

    “Using Bentley’s new Carbon Analysis capabilities helps transform the tedious task of carbon reporting into a smooth, automated process,” says Chris Bradshaw, a year into his role as Bentley’s Chief Sustainability Officer, in Bentley’ press release.

    “And the best thing about it: it’s free,” he adds from the conference stage at Year in Infrastructure.

    WSP, a global leader in sustainability consulting, has participated in the early access program for these new tools. Kelvin Saldanha, an associate director at WSP, highlighted how the integration of Bentley’s capabilities has improved the transparency and speed of carbon analysis. “With Bentley’s new Carbon Analysis capabilities, our design team has better transparency to calculate, analyze, and report meaningful carbon footprint impacts within any design change—in real-time with the click of a button, which has greatly reduced feedback loops from months or weeks to days,” he stated.

    What Exactly Does the Carbon Analysis Tool Do?

    Automated material quantification: It automatically reads the Bentley BIM model and related files and data, including those created by another vendor, and aggregates them all into a digital twin. The carbon tool automatically calculates the volume and types of materials used in the project, quantifying materials like concrete, steel, and other building components using data linked to specific material libraries or databases.

    With all data under one roof, volumes (needed for material amounts) quantities (read from BOMs and parts lists) and material specifications, combine for a total carbon footprint. No external carbon analysis app to learn, no Excel spreadsheets to be rounded up, no structure in the projects overlooked.

    The tool uses predefined carbon factors from third-party databases or user-specified data and considers the entire lifecycle of materials, from extraction to production.

    Users can adjust material choices, design shape and quantities or design parameters to explore how different alternatives impact the overall carbon footprint. For example, users can substitute concrete types or adjust structural elements and immediately see changes in the carbon output.

    Updates are no problem. Carbon Analysis will update its calculation automatically based on changes made to BIM, files, or data. The tool uses quantified data to assess the embodied carbon of materials using predefined carbon factors from third-party databases or user-specified data. This calculation considers the entire lifecycle of materials, from extraction to production.

    A key feature is the automated material quantification, which aggregates data from various project sources, providing a comprehensive digital twin view. This automation simplifies data collection, reduces the need for estimations, and enables accurate tracking of carbon impacts. Additionally, the 3D visualization capabilities offer an intuitive way for users to see carbon impacts, represented through heat maps, directly within their design models. This feature aids in making more informed decisions quickly, ensuring that sustainability remains a priority throughout the project’s lifecycle.

    If you want a detailed report, you can have it – with one click of a button. Use it to impress at internal reviews, regulatory compliance, or communication with other stakeholders.

    In-content 3D visualizations: With all models and the apps and data under one roof, you can view it all in one window. Instantly see embodied carbon in a 3D heat map overlaid on 3D geometry. As design changes are made, the tool automatically updates carbon calculations and visualizations. This allows for a dynamic and iterative design process where sustainability remains in its rightful place, on top from start to finish.

    Users can share the digital twin, including the carbon calculations and visualizations, with anyone and everyone. All sharers are accessing a single source of truth, one dataset for all. Now ends outdated carbon analysis, done once because of the massive effort it exacts, being passed off as reflecting the project as it finally is.

    Engineering teams that are able to integrate sustainability into their workflow in this manner are enabled to make data-driven decisions that can reduce the overall carbon footprint of infrastructure projects.

    Bentley’s announcement of an integrated carbon calculator reflects its commitment to supporting the infrastructure sector in achieving global decarbonization goals. Bentley has shown concern for the environment before green was cool and, despite the distraction of a world whose attention swivels to the shiny object du jour, stays focused on matters of existential importance.

    The Carbon Analysis tools are now generally available to users of Bentley’s iTwin Experience, though a license from a third-party carbon assessment tool is required for detailed analysis.

  • Infrastructure: How Did We Get Here?

    Infrastructure: How Did We Get Here?

    Letting the days go by, let the water hold me down
    Letting the days go by, water flowing underground
    Into the blue again, after the money’s gone
    Once in a lifetime, water flowing underground
    And you may ask yourself, “How do I work this?”

    —Once in a Lifetime, Talking Heads, 1980 (Listen on Apple Music, Spotify)

    Our infrastructure is crumbling. Dams, thought to last forever, are failing. Bridges that need attention are being ignored. Vast parts of the country remain unconnected. Indeed, Bentley Systems and all finalists present at the Year in Infrastructure event, all of us immersed in infrastructure, are part of the solution, not the problem, right?

    But taking the stage on day 2 of the conference was Deb Chachra, professor at Olin College of Engineering and author of “How Infrastructure Work, Inside the Systems that Shape Our World, graciously provided by Bentley Systems to media in attendance. Chachra looks at the bigger picture, going back to the earliest water systems, before “infrastructure” was a word, connecting infrastructure with energy. How one begets the other has given us systems that grow exponentially. They feed off each. All of them have big-time unintended consequences. Bad ones. It is leading to the despondency she sees in her students who think the previous generation has benefitted from the systems created (energy, transportation, infrastructure, etc.) and left them the mess to clean up.

    Inside the Systems that Shape Our World

    The following is a transcript, more or less, of Prof. Deb Chachra’s talk.

    An engineering education pushes us to think about the bigger picture. It’s not just about infrastructure, but people, communities, their environment. It’s not just about the latest tools and systems; it’s about creating a better, more sustainable and inclusive world. That’s something we can always aspire to. I like to do big-picture thinking, so when I get into infrastructure, I’m mostly interested in how students work with knowledge.

    I base my favorite definition of technology on a science fiction author. She pushes back against the idea that technology is just the latest cutting-edge stuff. She said that “technology is how humans focus physical reality, how we shape the material world.” I love that. That definition reminds us that technology is more than just what is the latest development. That definition is about our interaction with physical reality. Infrastructure fits in this definition.

    I’m the daughter of immigrants to Canada. As a kid, I was really aware of how different life was for my parents and their families back home. We had to make sure that we had water and electricity all day. In the summertime, power could go out. It made me aware of how much daily life is made possible by the support of infrastructure. Here, I turn on the lights and turn on the tap, and I don’t even think about it. Those needs are met and those systems enable my life.

    There are so many examples of this. Wherever you live, once you have infrastructure that meets your survival needs, the next thing that people focus on is their desires and aspirations. That connection is so certain that people studying economic development can use artificial light as a proxy for progress in a region. This connection is tied to agency and it’s super important. Amartya Sen, who studied some of the poorest communities in the world, wrote that poverty isn’t just a lack of income but a lack of freedom to lead the kinds of lives people value. That’s the sustained freedom that helps us achieve our potential.

    Our agency, my agency, comes from being part of these collective systems. It’s more than what I can do on my own. When I think about water, sewage, energy quality—these are the things that really differentiate places. They’re about networks that bring people together. They’re intrinsically linked, not just to the people where they are but also to each other. I use a canonical example: living in New England, where infrastructure was built out in the mid-20th century. Everyone needs clean tap water every day. It makes sense to have a network that serves everyone. It’s more efficient, not less, to have a networked system.

    Once you build out a system, it only requires a little energy to serve additional people. As an engineer, that made perfect sense—it’s a matter of energy and efficiency. Our systems are powered by collective effort. Energy is the actual currency of our material world. We use energy to get more energy. The first coal-powered engine in England used coal to pump water out of mines so that more coal could be mined. Looking at global energy usage over the centuries, you see how we’ve scaled up to serve more and more people through these systems.

    Now, we live in a world of global networks. Take containerization, for example. It made global trade and the movement of goods much more efficient. A lot of the stuff you use every day has been transported across the planet. It’s part of a global civilization that allows us to maintain relationships and communities across distances—whether that’s with family, colleagues, or online communities. And now, communication networks are nearly everywhere, with people having access to them wherever there is power.

    But we’ve also become embedded in systems that extract resources, mine them, move them and transform them. The Industrial Revolution supercharged extraction, turning raw materials into the components of modern life. Take copper, for example. It was considered a precious metal not because it’s rare but because of its unique properties. It’s necessary for electricity and for conducting power across vast networks. As we’ve gained access to more energy, we’ve made things more disposable, moving from a world where materials are precious to one where they are used freely.

    These collective systems have allowed us to live in a world of abundance, but they have also placed harm elsewhere. The benefits are often enjoyed by people far from where the negative impacts are felt. Think about pollution or climate change—these problems affect people differently depending on where they are and often those contributing the least to the problem are the ones facing the most harm.

    All of these networks have benefits and harms and their distribution is often unequal. The landscapes that our systems were built on assumed stability, but now we have to contend with the impacts of climate change. We have to adapt our systems to a new reality, to a world where we need to both mitigate and respond to environmental changes.

    When you look at the Earth from space, you realize that it’s a closed system. Every atom that we mine has to go somewhere. That means every decision we make about resources has a cost, whether that’s mining or building infrastructure. We have to find ways to meet our needs without depleting our resources.

    The reality of our planet is that it is finite, but we can adapt. We need a dramatic shift in how we think about energy and materials. The last big shift came when we used energy to extract resources on a large scale. Now, we face two global problems—energy and materials. The students I teach, the next generation, understand that they will be dealing with these issues for the rest of their lives.

    We’re at a point where we need to align our thinking to build a world with renewable, scalable and resilient systems. It’s about creating opportunities and building systems that are both sustainable and equitable. There’s no path to this future that doesn’t involve transforming our infrastructure. That’s one of the powerful possibilities of this moment: the potential for everyone to access energy and resources.

    It’s hard and we have yet to figure it all out, but we have the tools and the vision to get there. I talk about this a lot with my students—about embracing agency and the role of technology in shaping the future. We have to think about our values and make them explicit, not just assume them. It’s about thinking critically about our relationships, our responsibilities and how we engage with complexity in a world that’s more interconnected than ever.

    The place I want to end is with the idea of building a world where everyone has access to energy, where systems are resilient and sustainable and where we all have the freedom to live meaningful lives.

    That’s our goal and it’s within our reach.

  • Scenes from Bentley’s Year in Infrastructure 2024, Part 1

    Scenes from Bentley’s Year in Infrastructure 2024, Part 1

    Every year around this time, the best infrastructure projects that use Bentley Systems software (as determined by independent judges) are feted at the only black-tie awards ceremony in the industry at a conference named The Year in Infrastructure.

    This year’s event is being held in Vancouver, a mere two-hour flight from SFO for yours truly.

    Once again, the projects are breathtaking in their scale. I regret only that I can’t see all the finalists give their presentations. The presentations all happen in one day in parallel tracks, and the choice of which one to go to at any one time can be an excruciating decision.

    Here are highlights from what I managed to attend.

    Milan Style

    Milan is Italy’s fashion center, and you might expect its buildings to be designed with style. ENI headquarters, a curvaceous building with a fantastic sky bridge, does not disappoint. The sky bridge connects two towers, and the preassembled steelwork was so massive that physics-based animation was used to make sure cranes would not tip over as they were hoisted in place.

    Webuild used Bentley’s SYNCHRO software. In addition to making sure cranes didn’t tip over, SYNCHRO created a virtual construction environment, performing clash detection and scenario analysis to visualize every step of the construction process.

    Before anything was made in the field, it was made on the screen,” says Allesandro. Being able to see how everything would go together on their iPhones helped reduce rework by 90% and shrink the construction timeline from 85 by an astounding 81 days! Less time on the job also means less injuries. Webuild manage to throw a perfect game: zero injuries.

    Hutama’s Phase 2A of Jakarta’s Metro

    PT Hutama Karya used Bentley’s software to model Jakarta’s  MRT Phase 2A, which involves building two underground stations. Hutama’s challenges included a dense urban population and geotechnical conditions. Using Bentley’s geotechnical software Leapfrog and PLAXIS for soil analysis improved soil data collection and analysis, saved the equivalent of $2.5 million. Hutama used SYNCHRO for 4D planning, ProjectWise and iTwin for digital twin collaboration and LumenRT. So much of the project was modeled digitally, making onsite inspections unnecessary 90% of the time.

    To be continued…